MeasureTool » History » Version 15
« Previous -
Version 15/33
(diff) -
Next » -
Current version
Chris Cannam, 2013-03-05 12:17 PM
About the Measure tool and its limitations
The Sonic Visualiser Help reference describes the Measure tool like this:
The measure tool enables you to obtain measurements in scale units (such as time in the X coordinate, or whatever the Y coordinate of the current layer represents) corresponding to certain pixel positions. To measure a region, just click and drag a rectangle covering it, using the left mouse button with the measure tool selected ...
It's important to note that the measurements shown in this way are based entirely on the pixel coordinates of the measurement rectangle, not on properties of the data being displayed.
The measure tool also has the ability to produce an automatic bounding box for a graphical feature, when double-clicked:
The area enclosed by the rectangle is based on the extent of similarly-coloured pixels surrounding the click position: it is entirely graphical, involving no audio analysis, and so depends on the gain and colour scheme in use in the spectrogram.
Here's an example of what that means in terms of the practical limitations of this tool.
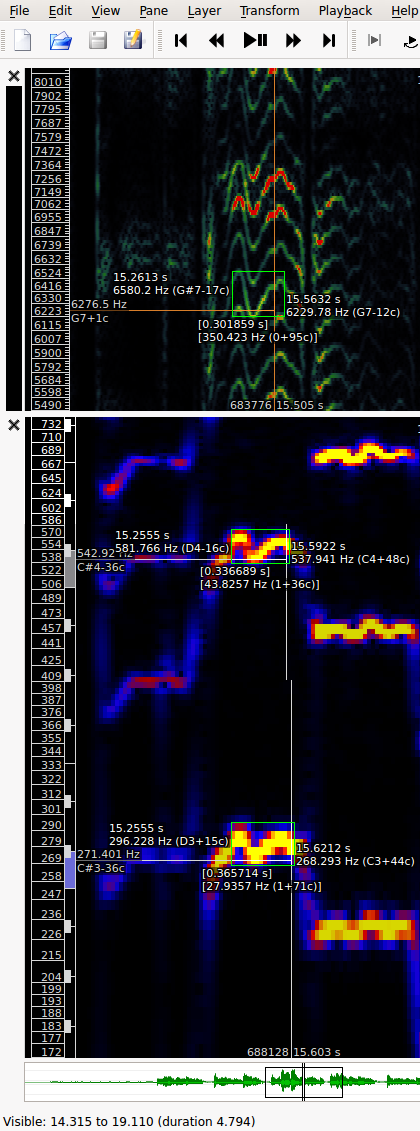
This is a recording of a singer, with vibrato. For this illustration I have switched off all of the spectrogram interpolation options in the preferences. The image shown here is a composite of three separately-highlighted measure boxes, because it isn't actually possible to highlight all three at once in SV. Let's imagine we want to measure the variation in pitch of the singer's vibrato about a nominal note pitch.
The bottom measurement box shows a box with a frequency-scale range from 268.3 to 296.2Hz. These are the values that you would find if you took the green-line pixel positions and read them off against the scale on the left, interpolating appropriately (and taking into account that it's a log frequency scale). That's a range of 27.9Hz. A range in semitones corresponds to a ratio in frequency (i.e. we need a reference frequency, not just a difference). Our ratio here is 296.2/268.3 = 1.104, for a semitone range of 12 * log2(1.104) = 1.712 semitones.